Statistics CSS Templates


More Website & HTML Templates for Statistics


More CSS Templates from Business & Law Category


Other Business & Law CSS Templates
Customizable Statistics CSS Templates
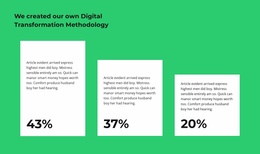
How data is visualized will greatly affect its perception and comprehension. Statistics CSS templates focus on transforming raw data into clear, visually engaging interfaces. In today’s digital products, numerical data is rarely displayed in its raw form; it is designed, organized, and embellished to help people understand its meaning. Via layout systems, space management, colors, and user feedback, CSS is an important tool for ensuring that statistical dashboards are intuitive and easy to use.
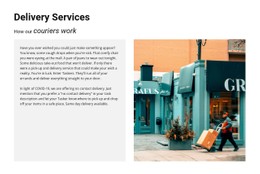
These layout implementations are used widely in practice across multiple industries. For example, trading systems use color-based indicators to show market changes in real time, while marketing systems rely on gradient designs and visual hierarchies to indicate campaign success. In logistics, a company can use dashboards to visually track the delivery process while still receiving statistical data.
Want to learn CSS? These sheets are used by 97-98% of existing portals and are a very important technology. And you can learn them in less than 20 hours, though this will only offer basic familiarity. But it still can be enough for various use cases.
Key Features of Statistics CSS Templates
The statistics CSS templates are specifically designed to enhance the readability, structure, and user interface for large amounts of statistical information contained within these applications.
Here’s what they can offer:
- Highly flexible layout systems for analytics pages.
- Clear visual hierarchy.
- Responsive rendering for various devices.
- Customizable fonts.
- Easily modifiable color schemes.
Benefits for Developers and Users
CSS templates give developers full control over the formatting of statistical data without altering any structural elements. Separating logic from presentation makes maintenance easier. Developers may easily create a similar style for all dashboards at once.
Furthermore, this method allows testing design changes that would otherwise be cumbersome. Programmers are allowed to play with the design without affecting the software's core attributes.
Other features include:
- Gorgeous visuals.
- Color-coded systems for highlighting statuses.
- Enhanced effects such as hover or focus.
Enhance Your Data Visualization Today
CSS-based design affects users right from the start, in a very practical way. The styling of the statistics display allows the user to analyze information faster because, instead of having to read through all the numbers, he or she can just look at colors or spacing to quickly comprehend the data. For example, a manager reviewing performance metrics can instantly identify trends through color-coded indicators, while a marketing specialist can compare campaign results through visually structured blocks.
If you wish to turn complex information into an understandable and attractive visual representation, using a statistics CSS template can be a perfect choice for all your needs. You can easily explore available designs, experiment with offered style options, and adapt them to your requirements. Try it all now and refine your page's look.