Reports HTML5 Templates
-
-

-
-
-
-
-
-
-
-
Free Website Builder SoftwareDownload
-
-


More Website & HTML Templates for Reports


More HTML5 Templates from Business & Law Category


Other Business & Law HTML5 Templates
A Creative Advanced Reports HTML5 Template
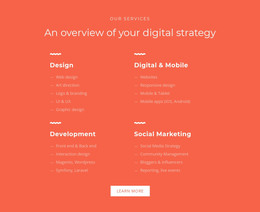
Want to use a reliable foundation for your analytics site? A report's HTML5 template allows you to use one. Moreover, it achieves this by using the latest web development standards and technologies. Your reports page can now display complex and interactive information. It can include metrics and statistical data, and even supporting animations.
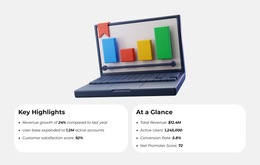
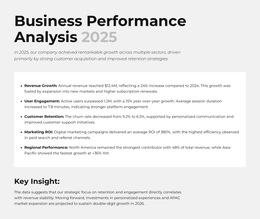
Pre-designed HTML5 report templates are available and can be very helpful for developing dashboards. The templates usually have space for displaying metrics, charts, KPIs, and detailed data tables. For example, in marketing analytics software, it may be necessary to display metrics for marketing campaigns, traffic reports, and conversion reports. In financial software, it’s often important to display revenue and expenditure reports, and in SaaS software, to provide reports on user activity and business operations.
Core Sections in Reports HTML5 Dashboards
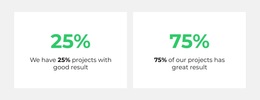
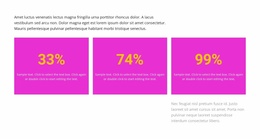
Only 50% of companies use metrics for decision-making. While it might not sound like a big number, it actually translates to tens of millions of businesses.
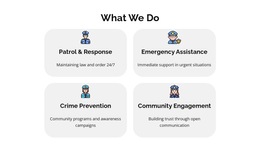
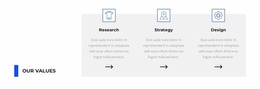
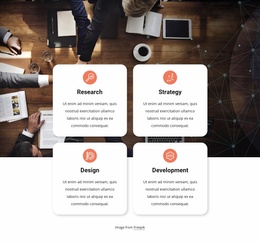
Analytics pages usually include several structured elements:
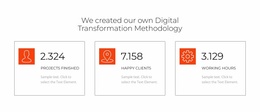
- KPI panels highlighting key business indicators.
- Analytics charts presenting trends and statistics.
- Interactive tables showing detailed report information.
- Navigation blocks for switching between modules.
Dynamic Solution for All Businesses
Developers can now benefit from these report templates, since they provide a ready-to-use structural framework for dashboards. They’re easy to work with and bring all of the modern capabilities to the table. The developers aim to build reporting systems much faster while maintaining a clean codebase.
Here are some of their additional features:
- Very fast loading speed.
- Easy integration with JavaScript chart libraries.
- Scalable layouts for expanding analytics platforms.
- Native multimedia support.
- Structured sections for metrics, charts, and data tables.
- Dynamic content support.
- Compatibility with modern frontend frameworks.
For end users, this means that a well-designed reporting dashboard makes it easier to understand complex data. No longer are they forced to work directly with datasets to try to understand trends and changes in performance. Well-designed charts, statistics, and navigation all help to create a better user experience.
Launch Your Reporting Dashboard Today
Go to Nicepage and get familiar with reports HTML5 templates it offers. Simply find one that best suits your business needs and customize it. Do it now and launch a reporting page that will age well.